
Any company of a decent size and age that creates software at any scale will have gone through a number of “technical evolutions”. These come along as you hire new people, create new products or just better ways of doing things come along. The kind of changes I’m talking about are the adoption of different technologies over time and the introduction of new ones. This cuts right across different aspects of software, from languages to frameworks to techniques to tooling. We end up collecting an number of each for various reasons. It may even be a conscious choice where we see that one technology is better suited to solving a particular problem than another or one system is simply not as important and don’t need the same investment. The reasons here aren’t too important, the fact is you are in this situation and will be for a foreseeable amount of time.
When it comes to deployment software there are often lots of changes that have happened over time and more than likely more than one tool that is currently in use across your teams.
I know within the org I work in we have about 4 (that i know of!)
- Jenkins
- GitLab Pipelines
- Heroku Pipelines
- Octopus Deploy
The issue we have is that we have no insight across the teams into what is deploy, to where, when and how. There is very little reporting built into these tools to see across all of your applications and even if there were you would have to switch between applications to see any of this and implementations would likely differ wildly.
What we wanted to do was to bring all of this information together into one place so that we can have some sort of visibility and enable some level of insight into the applications that are being deployed across teams.
Web-hooks
Web-hooks are the key to this. Most of these applications support web-hooks right out of the box. Even those that don’t we can provide a pretty simple curl script to inset into any shell script that is run as part of the deployment. Not as nice but it gets the job done.
So we are going to use web-hooks. Great. We need some sort of HTTP endpoint somewhere. And I don’t want to be writing and managing a whole bunch of code to do all this, I especially don’t want to be managing any infrastructure. I also have the issue that some of these systems are on-prem and some are cloud hosted SaaS products. You may think “cloud functions!” and I would agree that solves the infrastructure problem. But I still have to write, test and deploy some code (another deployment to track!).
Azure Logic Apps to the rescue, these are really simple drag and drop style connector apps that are perfect for simple things like this, think of ifttt or zapier on crack. We can have a HTTP trigger to receive JSON data and dump it into a document store for later processing. Think of them as a layer over cloud functions that writes the code for you. They are pretty simple and provide a range of out of the box triggers and connectors, including HTTP and Cosmos DB. So great, we can take in the web-hook data and store it into a document store.
In fact they are so simple in this case that there are only 2 steps
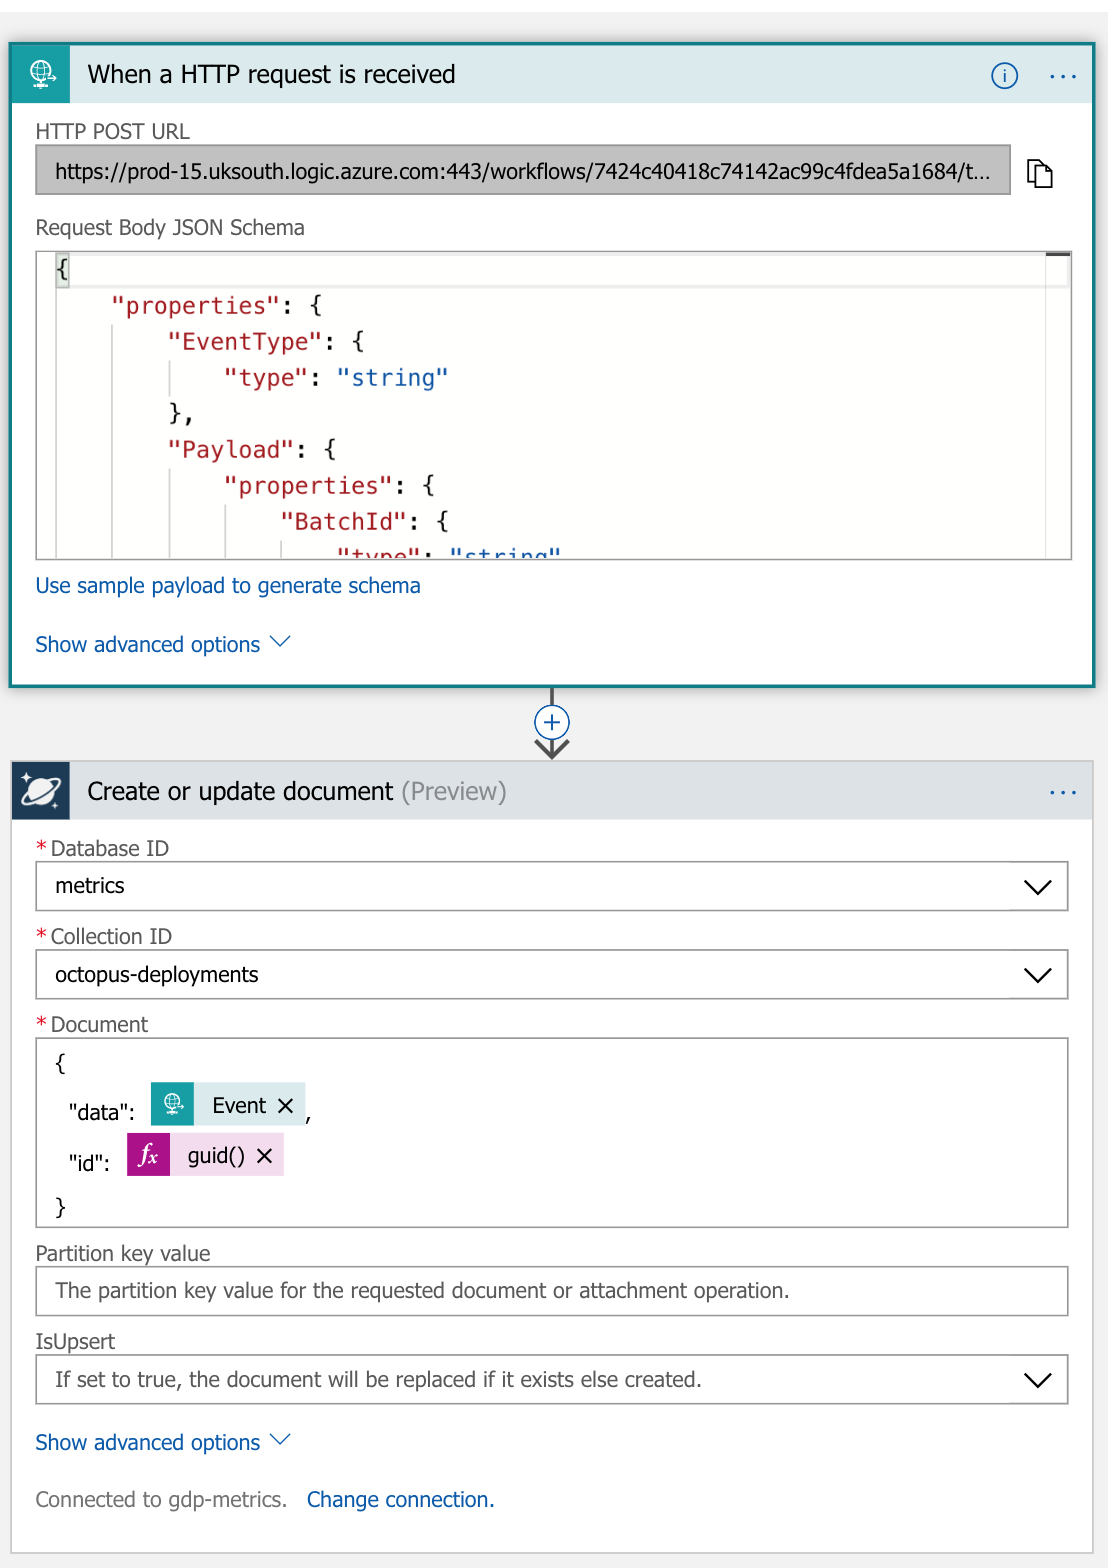
We can use the first request (or any sample data) to generate a JSON schema to help who the shape of the data. (This comes in handy with the Heroku issues later)
The one gotcha here is to make sure that you add in your own id that is generated at the point of the insert, and then nest your data inside there somewhere. Don’t rely on the id data that may come in from the web-hook. It may be a static id for an app or deployment run in which case your data will be overwritten as new event come in for that app or deployment (start, finish, error etc)
At the moment I am dumping all of my data for each hook into different table. Im purposefully not doing any processing or transformation here. I want all the data for using later.
I rinse and repeat this for each of the different data sources. Creating a new, cosmos db collection and logic app for each data source.
Issues
As you can imagine there is no way that these different systems were going to be sending me any standard format of data. Not even a little bit..
Octopus
The data coming out of the Octopus subscription is fairly good as you might expect from a deployment specific tool. The biggest problem is that it is all referential. It sends down IDs for projects and environments rather than their names. Which is a little bit of a pain. There are APIs that can be queried to get further information on each of these referenced resources. However, the octopus server sits internally and isn’t accessible from Azure. To get around this i have simply manually dumped out the JSON for both the environment and projects and uploaded them to a Sharepoint site that is accessible by Power BI. I was then able to pull this into a data set, flatten it and link it to the deployment data to get application and environment names rather than just ids. I guess if it becomes a pain I could look at automating this in the future.
Heroku
Within Heroku each app is tied to a pipeline which has a stage. There is the notion of coupling an app to a pipeline and stage. However none of this information comes over within the release web-hook which is focussed primarily on apps and not pipelines. And at present there doesn’t seem to be any web-hooks associated to pipeline actions specifically. So we would have to query the specific pipeline couplings for an app after we receive the web-hook from the app deployment. Thankfully there is a pipelines API that allows us to query the pipeline couplings from the appId
https://devcenter.heroku.com/articles/platform-api-reference#pipeline-coupling-info-by-app
This looks something like this, with the addition of an Auth header.
$ curl -n https://api.heroku.com/apps/$APP_ID_OR_NAME/pipeline-couplings \
	-H "Accept: application/vnd.heroku+json; version=3"
This returns the details of the coupling of the pipeline to the app like this
{
	"app": {
		"id": "01234567-89ab-cdef-0123-456789abcdef"
	},
 	"created_at": "2012-01-01T12:00:00Z",
 	"id": "01234567-89ab-cdef-0123-456789abcdef",
 	"pipeline": {
  		"id": "01234567-89ab-cdef-0123-456789abcdef"
    },
 	"stage": "production",
 	"updated_at": "2012-01-01T12:00:00Z"
}
This gives is the stage which will be our environment data.
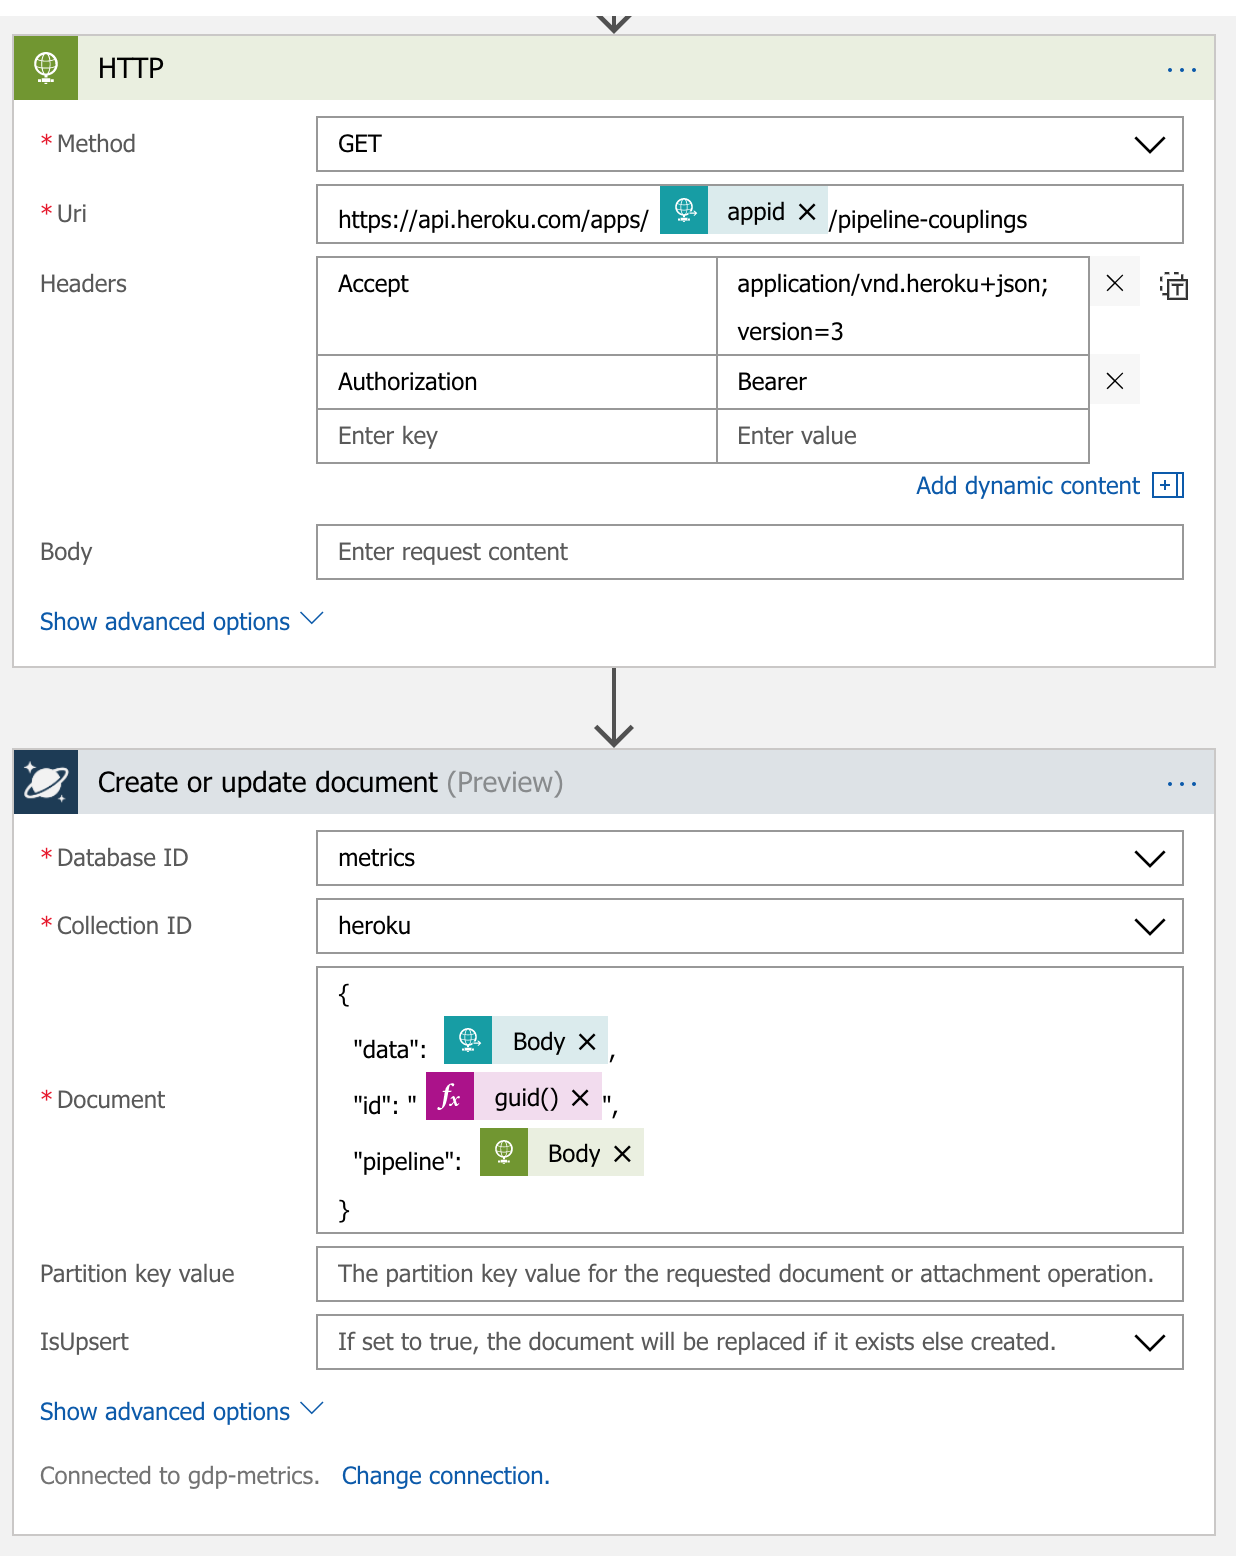
To do this we are able to insert another HTTP request into the logic app. It will make a request to the Heroku API using the app id received in the web-hook to get the pipeline information and attach it to each record when inserting into the db. This way we now have the application data and the pipeline that it is attached to. This logic app now has 3 steps but it was super simple to achieve this and is sill very easy to understand whats going on. The HTTP trigger is omitted from this picture is identical but we have added in another HTTP request step before saving to the DB. We have used the JSON schema to pull out the appid from the incoming JSON and pushed that in as a part of the HTTP request. We then append the body of the response to the document we insert, alongside the web-hook data.
GitLab
There seem to be a few more issues with the data that comes back from GitLab. Firstly there is no notion of an environment in the pipelines web-hook data. So its a little tricky to figure out what has been deployed and where. Through the teams that use it within our org there seems to be some loose naming conventions for pipeline stages that has allowed me to pull the data apart in processing and gain some insight into what has been deployed and where. The deploy stage is helpfully called deploy and each job is named using the basic schema of deploy:environment and although all the jobs show up in the data only the one that has actually been deployed will be marked as succeeded.
Something like this
{
   "id": 467840,
   "stage": "deploy",
   "name": "deploy:uat",
   "status": "success",
   "created_at": "2018-03-24 09:50:30 UTC",
   "started_at": "2018-03-24 09:54:05 UTC",
   "finished_at": "2018-03-24 09:58:01 UTC",
 ...
I am able to transform this data later when processing it. So i can get the data that i need but it isn’t perfect.
Rationalising the data
From the data collected above I spent some time thinking about what data was strictly needed to do some basic reporting and insight.
- Date
- Some unique ID
- Environment
- Status
- System
I then used Power BI pull in the data and transform and shape it into the structure above to end up with one stream of data that could be used to visualise. I will go into what i did within Power BI in part 2 of this post.
Future nice to haves
Throughout doing this i have been thinking about how this data may be used to provide insight into the development and deployment process within teams.
- Deployment length - to help identify long and problematic deploys
- Explicit commit sha to track back to source code
- User that triggered the deploy